Home/ Blog / Using Internal and External Data for Risk Insights and Predictions
Risk mitigation is a critical and complex process. A risk needs to be identified in time to be properly mitigated before it negatively impacts the bottom line of the business. While having real-time knowledge of emerging risks for all business units is a necessity for risk stakeholders, this information has historically been difficult to manage. Most risk managers must manually sift through disparate information and data that can enable predictions and insights.
 The smarter approach is to set up a feed of internal and external risk related data that enables risk managers to automate evaluation processes. Combining external and internal Key Risk Indicators (KRIs) with Key Performance Indicators (KPIs) can result in streamlined risk analysis.
Tracking KRIs and KPIs allows your business not to just identify emerging risks, but also assess the effects of those risks. Share on X
The smarter approach is to set up a feed of internal and external risk related data that enables risk managers to automate evaluation processes. Combining external and internal Key Risk Indicators (KRIs) with Key Performance Indicators (KPIs) can result in streamlined risk analysis.
Tracking KRIs and KPIs allows your business not to just identify emerging risks, but also assess the effects of those risks. Share on X
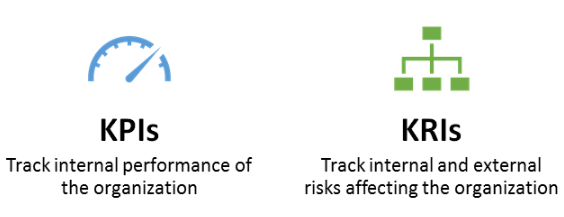
The difference between KPIs and KRIs
There is an overlap between KPIs and KRIs but there are important differences that need to be understood. Key performance indicators, as the name suggests, directly track performance metrics while risk indicators directly track risk metrics. There are indicators for risk, performance, and key indicators which are related to both. Another important distinction is that we are discussing risk indicators relevant to operational risk – otherwise all KPIs are tied to different types of risks. For example, if sales are too low it poses a financial risk to the organization. However, this is a matter that needs to be solved by the sales and the finance department, and not necessarily under the domain of enterprise risk management. Similarly, KRIs also track the performance of the risk department.KPIs
KPIs provide data about the performance of the organization. Tracking the sales numbers is a good example of a KPI. The higher the sales, the better the performance of the sales and marketing department. KPIs generally track the positive actions taken by the employees of the organization.KRIs
KRIs provide data about risk. They do not necessarily correlate with organizational performance. Tracking the breakdown of IT equipment or downtime by the internet service provider is a key risk indicator. It tells the organization how dependable their current IT hardware and internet provider is and whether any accommodations need to be made for a backup.KPIs and KRIs
There are many indicators which function as both, key risk indicators and key performance indicators for different departments within an organization. The number of compliance violations in a department is a KPI for them – their aim is to ensure that they are compliant, and thus decreasing the number of compliance violations is an important indicator for their performance. The same metric is a KRI for the risk department, because it tells them that there may be risks present within different departments which are not being properly mitigated.
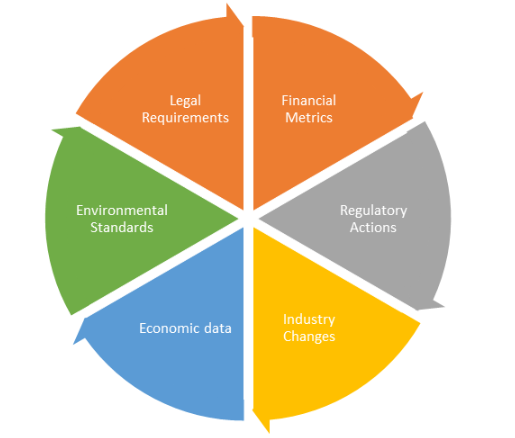
External data for risk
While performance metrics largely depend on the performance of the organization, risk metrics are often affected by factors outside of the organization’s control. These external metrics can be more significant than any internal risk metrics. Businesses operating in the financial sector are directly affected by the performance of financial markets. As we saw in the financial crisis of 2008, industries are interlinked, and one industry’s performance can significantly affect other industries. While the 2008 crisis originated in the financial sector, its negative effects were felt by every industry in the world. Regulatory information is also important for risk management solutions while being out of control of the organization. If there are any expected regulatory changes the risk for non-compliance increases. Similarly, a fluctuation in the prices or availability of inputs can drastically affect a business. If an essential component becomes unavailable it can result in profound ramifications. The 2004 tsunami affected many countries which were important resources for rare earth metals which are a necessary component for many electronics and storage devices. This resulted in decrease in availability of rare earth metals which reduced the supply of storage products such as hard disks and SD cards, and it took many years for the supply to become stable. The external indicators that affect your business are based on the industry your business operates in. Every industry has its own unique issues and business processes.
Using metrics for risk insights and predictions
Tracking these metrics allows your business not to just identify emerging risks, but also assess the effects of those risks. It is easy to see how each department will be affected by emerging risks. This can be accomplished through a manual approach or using automation. A manual approach requires dedicated employees to track all the important metrics. Due diligence must be performed to ensure that no important updates are missed. Once the data has been collected it need to be standardized and analyzed to generate predictions and insights. It is also important to map risks to business units and processes to determine the effects of emerging risks The whole process can also be automated through risk insight tools. Insight360 is our risk tool – it automatically tracks internal and external KRIs and KPIs and analyzes them to predict emerging risks. Want to learn more or see a demo? Get in touch with our risk experts.Request a Demo
Complete the form below and our business team will be in touch to schedule a product demo.
By clicking ‘SUBMIT’ you agree to our Privacy Policy.
Stay Informed About Upcoming Webinars & Events!